Use Investing Charts in 2026 to track market trends, spot opportunities. Make smarter investment decisions with insights to grow your profits wisely.
Have you ever felt lost while trying to read the market? I felt the same in the beginning and made wrong trades without any clear direction. The real problem is trading without data. I started using investing charts and it solved this for me. Now I get live data, price patterns, and trend signals in one place, which helps me make confident and profitable decisions.
What Are Investing Charts?
Investing charts are visual tools that show how an asset’s price changes over time. They help investors track stocks, exchange-traded funds (ETFs), market indexes, and other financial assets. These charts display historical price movements in a clear format, making market trends easier to recognize.
investing charts live can show whether prices are rising, falling, or moving within a narrow range. Some also include trading volume and technical indicators. These details help investors assess market behavior before making decisions. However, charts cannot predict future prices with certainty. They work best when combined with company research, market news, and proper risk management.
Read Also; REITs Investing for Beginners
Types of Investing Charts You Should Know
investing charts nifty come in different formats, and each one presents market data in a unique way. The right choice depends on how much detail you need and what you want to analyze.
Line Charts
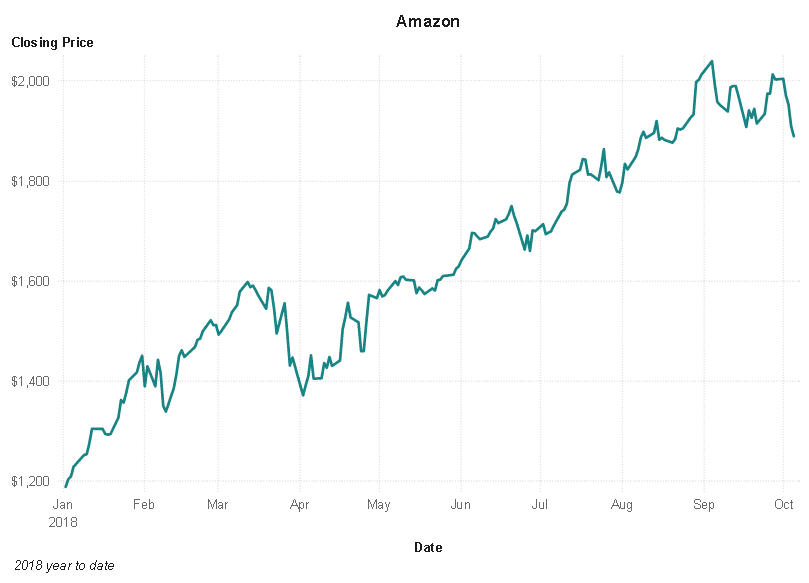
A line chart connects closing prices over a selected period. It gives a clear view of the overall price direction. Beginners often prefer this format because it removes extra details and makes broad trends easier to spot.
Bar Charts
Bar charts show four key values: opening, highest, lowest, and closing prices. Each bar represents a specific period. This format provides more information than a basic line chart and helps investors examine price fluctuations.
Candlestick Charts
 Candlestick charts display opening and closing prices through candle bodies. Their upper and lower wicks mark the highest and lowest prices. Green and red candles commonly indicate rising and falling prices, although platform colors can vary. These charts make price behavior and potential market shifts easier to examine.
| Chart type | Best use |
| Line | Spotting overall trends |
| Bar | Comparing price ranges |
| Candlestick | Examining detailed price movements |
How to Read Investing Charts Step by Step
When reading investing charts of stocks , it’s easier to see the wood for the trees if you are not reading individual lines or indicators.
- Determine the asset: Determine if the chart is for a stock, ETF, index or some other investment.
- Look at the time frame: Decide whether you want to look at daily, weekly or monthly data.
- Notice price trend: Time-price trend should be rising, falling or sideways.
- Look for highs and lows: Identify that prices are moving to new highs or new lows.
- Consider reviewing the trading volume: See if there’s increased activity or low volume indicating fewer participants.
- Look at other indicators: Moving averages and RSI can give additional information on trends and momentum.
Investing Charts display past performance, not future performance. Before taking a decision on an investment, always keep in mind the company fundamentals, market conditions and loss potential.
Key Trends, Support and Resistance Levels
investing charts gold are designed to make investors more aware of the price trends, and to find the area where there is a possibility that the market sentiment is shifting.
Uptrends, Downtrends and Sideways Markets
Uptrends are the polarity when prices make higher highs and higher lows. A downtrend is a trend that is characterized by a series of lower lows and lower highs. The “sideways” market situation exists when the price range is relatively narrow with no clear price trend. Traders are better equipped to handle these patterns if they are aware of them, since they can help them grasp the market’s structure.
Support and Resistance
Support is a price level that could help prices to rally or support a downtrend. A potential selling pressure area for further gains is resistance. These are not hard, set limits. They can be broken through in the market when things change. Investors should wait for confirmation prior to making a decision on a potential breakout or turnaround.
Popular Indicators Used With Investing Charts
Technical indicators are tools that can be used by investors to analyze the trends and movements in the market. There are different indicators used for different purposes.
Moving Averages (MA)
Moving averages determine the average price of a group of prices for a given period of time. They help to minimize short-term fluctuations and help to identify larger trends. Frequently used moving averages are the 50 day and 200 day averages. A higher price than a moving average could signal a positive trend.
Relative Strength Index (RSI)
The price momentum of an RSI is measured between 0 and 100. If readings are greater than 70, it may be an overbought condition, if readings are less than 30, it may be an oversold condition. However, these levels are not given any “guarantee” that a price reversal will occur.
Moving Average Convergence Divergence (MACD)
MACD identifies the strength of the trends and the direction of the momentum by comparing two moving averages. The MACD line crossing the signal line is a crucial factor that investors will be interested in. The crossovers can be a sign of a possible shift but may not be.
Trading Volume
Volume is the number of shares or units that were bought and sold within a particular time frame. Increased volume can help confirm a price breakout and low volume can indicate that the price might be finding less interest. Investors tend to look at volume when they look at recent averages for context.
Combine indicators in various ways
The more indicators agree on the market’s sentiment, the more helpful investing charts are. For instance, the positive momentum, increasing volume and the upward trend can help confirm a bullish signal. However, no combination is certain to be a successful one.
Common Chart Patterns and What They Suggest
The chart patterns are useful for investors to identify the price formation that could indicate a trend continuation or trend reversal. These patterns are not necessarily indicators of prediction though.
- Double Top and Double Bottom: When prices rise to a similar level twice and fall, it’s a double top. It could indicate a slowdown in the upward trend. When prices confirm a lower twice before moving up, it is called a double bottom.
- Head and Shoulders: There are three peaks, the middle peak is the tallest. It can be a sign of a possible trend reversal from uptrend to downtrend.
- Triangles and Breakouts: When price action begins to close in between trendlines, then triangles are formed and once the price breaks out, it is time to take the trade. A breakout is when prices break above or below a range. Volume confirmation is one way to diminish false signals by confirming the move.
Guide to deciding which chart time frame to use
The optimal time frame is dependent on investment objectives and frequency of checking the market. Investing Charts provide various charts of price action from minutes to many years.
- Short-term charts: Display data within a day or over a few hours. They are more suitable for the active traders.
- Daily charts: are used to view the price movements that occurred on a daily basis. They enable swing traders to gauge short-term trends.
- Weekly charts: Show larger trends and minimize the daily noise.
- Monthly charts: Benefit long-term investors to see performance over many years.
Pick the time scale corresponding to your approach. One can also gain more perspective into the situation before investing by looking at more than one timeframe.
Some common mistakes to avoid when reading charts.
- Only using one indicator
- Ignoring trading volume
- Misreading timeframes
- When it doesn’t work, someone else is wrong.
- Overlooking market news
- Ignoring risk management
- Making emotional decisions
Final Thoughts on Investing Charts
Investing Charts can be used to explain price movements, identify trends and evaluate the behavior of the market. The use of an appropriate chart type, time frame and indicators can enhance analysis. But charts aren’t always enough to make good decisions. Use technical analysis along with company analysis, market news, and sound risk management. An approach that is consistent can help you make better evaluations of opportunities.
Frequently Asked Questions about Investing Charts.
Q1. Is investing charting free?
Yes, there are lots of financial websites and brokerage platforms that provide free charts. There are some advanced tools for which you have to pay for a subscription.
Q2. Are investing charts suitable for people who are new investors?
Yes, there are simple line charts which you can begin with and then start to learn candlesticks and technical indicators.
Q3. How many times a day should investors look at charts?
It all depends on their strategy. Long time investors can see weekly or monthly charts, active investors can see more frequently.
Q4. Can cryptocurrency investing charts be used?
Yes, charts can be used to monitor cryptocurrency prices, trading volumes, and market trends. But the cryptocurrency markets can be extremely volatile.
Q5. What are the sites that offer investing charts?
Some of the most popular ones are TradingView, Yahoo Finance, and Google Finance. The features available are dependent on the platform.